
The annual fertility statistics were released last month. There wasn’t as much of the traditional story about how Peter Costello had single handedly forced up the fertility rate by introducing the baby bonus (here’s a story here – reasonably staid), which was so prevalent a few years ago, but I thought was worth updating a fertility post I wrote a few years ago, in which I tell you why it’s all to do with Gen Xers finally having children.
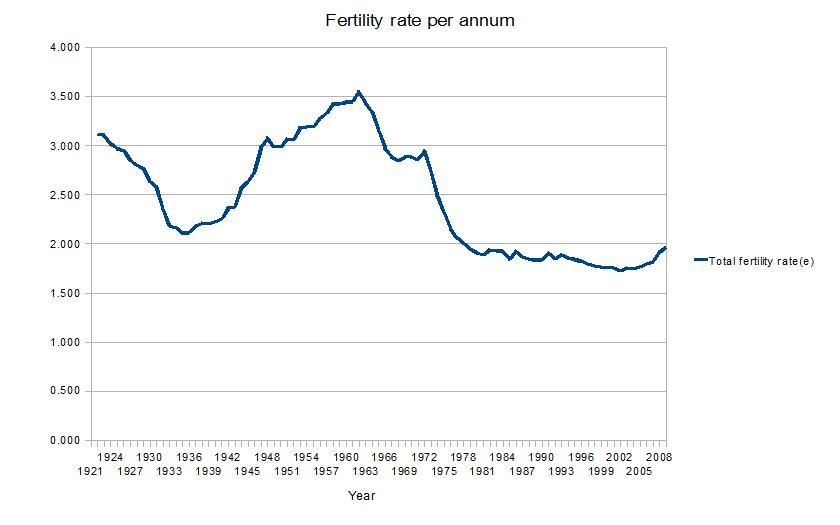
The total fertility rate* this year jumped from 1.92 per woman to 1.97 per woman – the highest since 1977. Here’s a graph showing the variability of this statistic.

But this statistic is misleading. The main reason there are more babies this year is about the age of the women having babies. A very strong trend in the past 10 years (at least) has been a delay in women having babies. If current age specific rates continue, women born in 1972 will be the first generation to have more babies in their 30s than in their 20s.
The graph below shows this effect.

And if we then look at the total births per woman, by the year of birth of the woman, we can see that this fertility rate is much smoother, and is gradually falling towards 2.0.**
 Interestingly, the total births per woman is not that far away from where it was for women born at the beginning of this century – a woman born in 1906 could expect to have 2.33 babies in her lifetime, and a woman born in 1972 can expect to have 2.0 babies in her lifetime. The rate peaked for women born in 1933, who could expect to have 3.11 babies in their lifetimes. You can also see that those women didn’t have nearly as many babies in their 30s as their mothers did – they had had two babies already in their 20s, so the fertility rate of women in their 30s dipped substantially.
So the baby bonus has had very little if anything to do with the number of babies born in Australia recently – it is just all those thirty something women finally having the second baby they always intended to have.
And here’s a couple of bonus interesting statistics that really jumped out at me when I was playing with these statistics – first teenage fertility rates:
 The teenage fertility rate for women born in the 20s is pretty similar to the teenage rate for women born in the 70s – it continues to drop now, but had an enormous jump in between. I had expected that precipitous drop in teenage birth rates that happened (the peak was for women born in the 50s), but I hadn’t realised it had gone up first.
And the fertility rates for women in their 40s still haven’t caught up to where they were for women born a century ago:

______________________________________________________________________________________________________________
* the total fertility rate represents the average number of babies that a woman could expect to bear during her reproductive lifetime, assuming current age-specific fertility rates apply.
** note that at the older ages, for babies born after 2008, I have projected by assuming that age specific fertility rates stay as they were in 2008. This probably understates the babies born to women born after the mid 60s slightly, as age specific fertility rates continue to increase, particularly in the late 30s and through the 40s.
Thank you for this post! I don’t how many conservatypes I’ve argued with over “Costello’s baby-boom”- I kept saying it’s not because of the fricking baby bonus Gen X’er’s have finally reached the point where those women who want babies are ready to have them (and the being ‘ready’ bit has a whole lot to do with who constitutes a ‘good mother’ IMO- ie she has an education, a stable job and relationship and has entered the property market- ie she’s middle class).
I wonder what the UK would look like? One thing we always notice whenever we leave SW London is how much younger the parents are in citiies like Liverpool and Manchester.
I do think a lot of it has to do with a particular career point – I see that a lot in the sector where I work where we hire a lot of women in their thirties seeking a career change who (about 30 to 40% if they’re in stable relationships) have children within two to three years of joining us. Same with longer term staff as well – mid 30s is when they seem to reach a decision point (same with my partner, come to think of it).
You write: * the population births per woman is calculated by adding up the total births in a given year, and dividing them by the total number women of childbearing (15-49) age that year
I still have trouble with this. Is it me, or does [total births / total women = ~2] mean that every woman of childbearing age in Australia has given birth twice this year?
Tiki, I’ve misquoted the ABS website – you’re right, what I wrote does suggest a lot of babies!
The ABS describes this as the Total Fertility Rate, which “represents the average number of babies that a woman could expect to bear during her reproductive lifetime, assuming current age-specific fertility rates apply.”
I’ve fixed the post, thanks.